


In this second article of „La Vie Automobile“ on the 1905 Vanderbilt Cup race, a more scientifical approach and kindof phylosofical thoughts were written down. As with the earlier 1895 Paris-Bordeaux race, the race results were given graphically; a method that would accompany many Grand Prix races wide within the next century.
Texte et images jpg avec l’autorisation de gallica.bnf.fr / / Bibliothèque national français, compilé par motorracinghistory.com,
La Vie Automobile – 5e Année, Vol. 5 – No. 216 – Samedi, 18 Novembre 1905
De la réprésentation graphique
Appliquée aux Courses d’Automobiles.
Qui donc n’a pas regretté au moins une fois, à propos de ces grandes épreuves internationales si âprement disputées chaque année, de n’avoir pas assisté aux épisodes de la lutte, de n’avoir point vécu la course en un mot ?
Savoir en effet que X est arrivé premier n’est, selon nous, qu’une des satisfactions du vrai sportsman ; connaître au contraire les incidents qui ont favorisé les uns au détriment des autres, porter au premier coup d’œil un jugement d’ensemble sur les efforts de telle ou telle équipe, supputer tout aussi nettement les indications techniques de l’épreuve, en déduire la valeur comparée des industries nationales concurrentes, voilà les buts réels, aussi nombreux que variés, qui tendent à justifier les courses, en légitiment à un certain point l’utilité.
Or, incontestablement les comptes rendus écrits, fussent-ils sommaires — tel les tableaux — ou bien abondants au point d’en être filandreux, ne peuvent traduire avec tout le relief voulu, le brio, la fièvre d’activité, le « struggle » d’une course.
Les Américains, gens pratiques, ont horreur de la formule, signe représentatif qui nécessite l’aide du cerveau, et lui préfèrent de beaucoup le trait, signe représentatif au même titre mais qui n’a besoin, lui, que du concours de l’œil. Pour la majorité des humains, il est certainement plus simple, et en tous cas plus rapide, de se servir des yeux que de l’esprit ; aussi par-delà l’Atlantique, où le temps paraît-il vau beaucoup plus d’argent que chez nous, a-t-on coutume d’employer la représentation graphique aux lieu et place de la représentation algébrique.
Ce n’est point la place ici de nous lancer à ce propos en des spéculations philosophiques sur le meilleur mode de représentation des idées, ni de discuter si nous ne perdîmes pas au change lorsque nos ancêtres abandonnèrent le hiéroglyphe, signe graphique exprimant une idée, pour la lettre, signe euphonique, don des Phéniciens. Peut-être reviendrons-nous sur ce point intéressant, mais pour l’instant nous nous bornerons à souligner les avantages remarquables de la représentation graphique, dans son application particulière à l’exposé des résultats d’une course automobile.
Considérons les conditions générales d’établissement d’une course : un certain nombre de concurrents partent d’un point déterminé, à une certaine époque, et s’efforcent d’arriver le plus rapidement possible à un autre point déterminé, placé à une distance connue et invariable du premier.
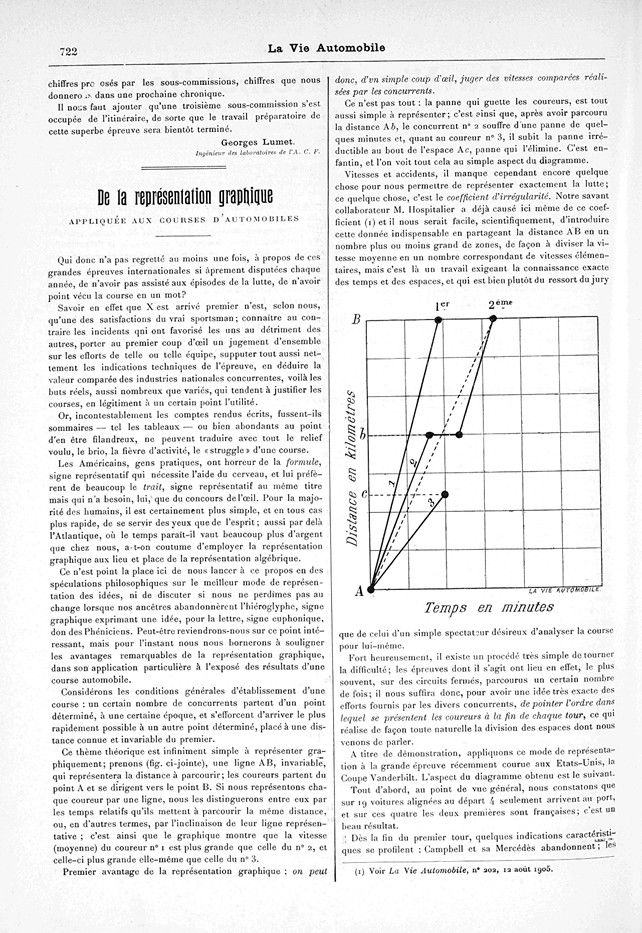
Ce thème théorique est infiniment simple à représenter graphiquement ; prenons (fig. ci-jointe), une ligne AB, invariable, qui représentera la distance à parcourir; les coureurs partent du point A et se dirigent vers le point B. Si nous représentons chaque coureur par une ligne, nous les distinguerons entre eux par les temps relatifs qu’ils mettent à parcourir la même distance, ou, en d’autres termes, par l’inclinaison de leur ligne représentative ; c’est ainsi que le graphique montre que la vitesse (moyenne) du coureur n° 1 est plus grande que celle du n° 2, et celle-ci plus grande elle-même que celle du n° 3.
Premier avantage de la représentation graphique : on peut donc, d’un simple coup d’œil, juger des vitesses comparées réalisées par les concurrents.
Ce n’est pas tout : la panne qui guette les coureurs, est tout aussi simple à représenter ; c’est ainsi que, après avoir parcouru la distance Ab, le concurrent n° 2 souffre d’une panne de quelques minutes et, quant au coureur n° 3, il subit la panne irréductible au bout de l’espace A-c, panne qui l’élimine. C’est enfantin, et l’on voit tout cela au simple aspect du diagramme.
Vitesses et accidents, il manque cependant encore quelque chose pour nous permettre de représenter exactement la lutte ; ce quelque chose, c’est le coefficient d’irrégularité. Notre savant collaborateur M. Hospitalier a déjà causé ici même de ce coefficient (1: Voir La Vie Automobile, n° 202, 12 août 1905) et il nous serait facile, scientifiquement, d’introduire cette donnée indispensable en partageant la distance AB en un nombre plus ou moins grand de zones, de façon à diviser la vitesse moyenne en un nombre correspondant de vitesses élémentaires, mais c’est là un travail exigeant la connaissance exacte des temps et des espaces, et qui est bien plutôt du ressort du jury que de celui d’un simple spectateur désireux d’analyser la course pour lui-même.
Fort heureusement, il existe un procédé très simple détourner la difficulté ; les épreuves dont il s’agit ont lieu en effet, le plus souvent, sur des circuits fermés, parcourus un certain nombre de fois ; il nous suffira donc, pour avoir une idée très exacte des efforts fournis par les divers concurrents, de pointer l’ordre dans lequel se présentent les coureurs à la fin de chaque tour, ce qui réalise de façon toute naturelle la division des espaces dont nous venons de parler.
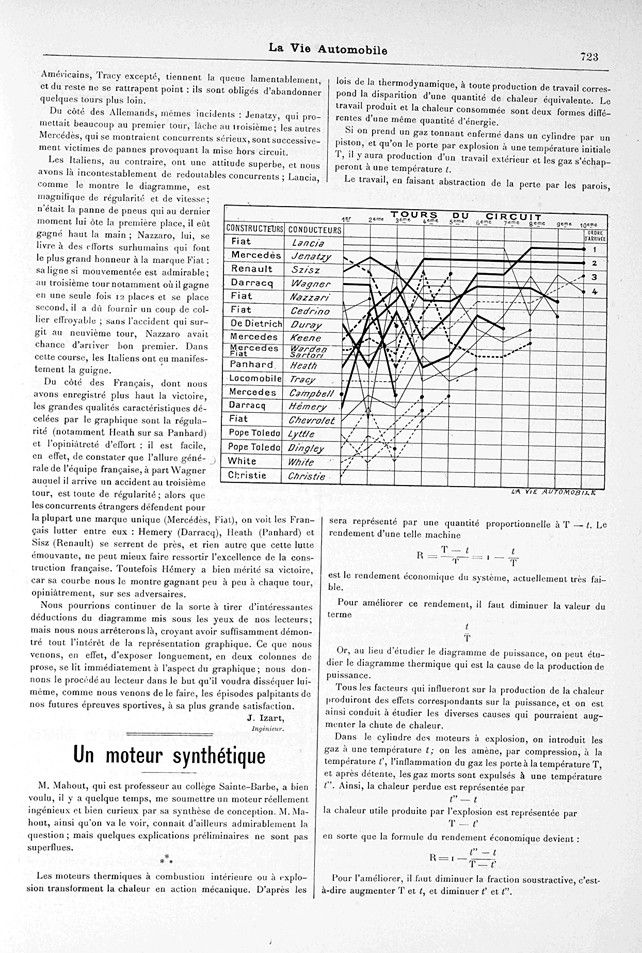
A titre de démonstration, appliquons ce mode de représentation à la grande épreuve récemment courue aux Etats-Unis, la Coupe Vanderbilt. L’aspect du diagramme obtenu est le suivant.
Tout d’abord, au point de vue général, nous constatons que sur 19 voitures alignées au départ 4 seulement arrivent au port, et sur ces quatre les deux premières sont françaises ; c’est un beau résultat.
Dès la fin du premier tour, quelques indications caractéristiques se profilent : Campbell et sa Mercédès abandonnent ; les Américains, Tracy excepté, tiennent la queue lamentablement, et du reste ne se rattrapent point : ils sont obligés d’abandonner quelques tours plus loin.
Du côté des Allemands, mêmes incidents : Jenatzy, qui promettait beaucoup au premier tour, lâche au troisième ; les autres Mercédès, qui se montraient concurrents sérieux, sont successivement victimes de pannes provoquant la mise hors circuit.
Les Italiens, au contraire, ont une attitude superbe, et nous avons là incontestablement de redoutables concurrents ; Lancia, comme le montre le diagramme, est magnifique de régularité et de vitesse; n’était la panne de pneus qui au dernier moment lui ôte la première place, il eût gagné haut la main ; Nazzaro, lui, se livre à des efforts surhumains qui font le plus grand honneur à la marque Fiat : sa ligne si mouvementée est admirable; au troisième tour notamment où il gagne en une seule fois 12 places et se place second, il a dû fournir un coup de collier effroyable ; sans l’accident qui surgit au neuvième tour, Nazzaro avait chance d’arriver bon premier. Dans cette course, les Italiens ont eu manifestement la guigne.
Du côté des Français, dont nous avons enregistré plus haut la victoire, les grandes qualités caractéristiques décelées par le graphique sont la régularité (notamment Heath sur sa Panhard) et l’opiniâtreté d’effort : il est facile, en effet, de constater que l’allure générale de l’équipe française, à part Wagner auquel il arrive un accident au troisième tour, est toute de régularité ; alors que les concurrents étrangers défendent pour la plupart une marque unique (Mercédès, Fiat), on voit les Français lutter entre eux : Hemery (Darracq), Heath (Panhard) et Sisz (Renault) se serrent de près, et rien autre que cette lutte émouvante, ne peut mieux faire ressortir l’excellence de la construction française. Toutefois Hémery a bien mérité sa victoire, car sa courbe nous le montre gagnant peu à peu à chaque tour, opiniâtrement, sur ses adversaires.
Nous pourrions continuer de la sorte à tirer d’intéressantes déductions du diagramme mis sous les yeux de nos lecteurs ; mais nous nous arrêterons là, croyant avoir suffisamment démontré tout l’intérêt de la représentation graphique. Ce que nous venons, en effet, d’exposer longuement, en deux colonnes de prose, se lit immédiatement à l’aspect du graphique ; nous donnons le procédé au lecteur dans le but qu’il voudra disséquer lui-même, comme nous venons de le faire, les épisodes palpitants de nos futures épreuves sportives, à sa plus grande satisfaction.
J. Izart, Ingénieur.
Translation by DeepL.com
On the Graphic Representation – Applied to Car Races
Who has not at least once regretted, with regard to these major international events that are so fiercely contested every year, not having witnessed the episodes of the struggle, not having experienced the race in a word?
Knowing that X finished first is, in our opinion, only one of the satisfactions of the true sportsman; on the contrary, knowing the incidents that favored some to the detriment of others, making an overall judgment at first glance on the efforts of a particular team, calculating just as clearly the technical indications of the event, deducing the comparative value of competing national industries, these are the real goals, as numerous as they are varied, which tend to justify the races, to a certain extent legitimizing their usefulness.
However, written reports, whether summary – such as tables – or so abundant as to be stringy, cannot unquestionably convey the desired sense of relief, brilliance, feverish activity, and struggle of a race.
The Americans, practical people, don’t like formulas, a representative sign that requires the help of the brain, and much prefer lines, a representative sign in the same way but which only requires the use of the eye. For most people, it is certainly simpler, and in any case quicker, to use their eyes than their minds; so across the Atlantic, where time seems to be worth much more than money here, it is customary to use graphic representation instead of algebraic representation.
This is not the place to launch into philosophical speculations on the best way of representing ideas, nor to discuss whether we did not lose out when our ancestors abandoned the hieroglyph, a graphic sign expressing an idea, for the letter, a euphonic sign, a gift from the Phoenicians. Perhaps we will return to this interesting point, but for the moment we will limit ourselves to emphasizing the remarkable advantages of graphic representation, in its particular application to the presentation of the results of a car race.
Let us consider the general conditions for setting up a race: a certain number of competitors start from a specific point, at a specific time, and try to arrive as quickly as possible at another specific point, placed at a known and invariable distance from the first.
This theoretical theme is infinitely simple to represent graphically; let us take (attached fig.), an invariable line AB, which will represent the distance to be covered; the runners start from point A and head towards point B. If we represent each runner by a line, we will distinguish them from each other by the relative times they take to cover the same distance, or, in other words, by the slope of their representative line; thus the graph shows that the (average) speed of runner No. 1 is greater than that of No. 2, and that of No. 2 is greater than that of No. 3.
The first advantage of the graphical representation is that it is possible, at a glance, to judge the comparative speeds achieved by the competitors.
That’s not all: the breakdown that awaits the riders is just as easy to represent; thus, after having covered the distance Ab, competitor no. 2 suffers a breakdown of a few minutes and, as for rider no. 3, he suffers the irreducible breakdown at the end of the space A-c, a breakdown that eliminates him. It’s child’s play, and we can see all of this from a simple look at the diagram.
Speeds and accidents, however, there is still something missing that would enable us to represent the struggle exactly; that something is the irregularity coefficient. Our learned collaborator Mr. Hospitalier has already discussed this coefficient here (1: See La Vie Automobile, no. 202, August 12, 1905) and it would be easy for us, scientifically, to introduce this essential data by dividing the distance AB into a greater or lesser number of zones, so as to divide the average speed into a corresponding number of elementary speeds, but this is a task that requires exact knowledge of times and spaces, and is more the responsibility of the jury than of a simple spectator wishing to analyze the race for himself.
Fortunately, there is a very simple way of sidestepping the difficulty; the events in question usually take place on closed circuits, which are completed a certain number of times; to get a very accurate idea of the efforts made by the various competitors, we simply need to note the order in which the riders appear at the end of each lap, which naturally achieves the division of space we have just discussed.
By way of demonstration, let us apply this method of representation to the great event recently held in the United States, the Vanderbilt Cup. The resulting diagram looks like this.
First of all, from a general point of view, we see that out of 19 cars lined up at the start, only 4 reach the port, and of these four, the first two are French; this is a good result.
From the end of the first lap, a few characteristic indications emerge: Campbell and his Mercedes drop out; the Americans, except for Tracy, are lagging behind miserably, and are not catching up: they are forced to give up a few laps later.
The same thing happened to the Germans: Jenatzy, who showed great promise on the first lap, dropped back on the third; the other Mercedes, which were serious contenders, were successively plagued by breakdowns that forced them to retire.
The Italians, on the other hand, have a superb attitude, and we have some formidable competitors here; Lancia, as the diagram shows, is magnificent in regularity and speed; were it not for the tire failure that took him out of first place at the last moment, he would have won hands down; Nazzaro put in superhuman efforts that do the Fiat brand great credit: his eventful line is admirable; on the third lap in particular, when he gained 12 places in one go and moved up to second place, he must have put in a tremendous effort; had it not been for the accident on the ninth lap, Nazzaro would have had a good chance of finishing first. In this race, the Italians clearly had bad luck.
As for the French, whose victory we recorded above, the great characteristic qualities revealed by the graph are consistency (notably Heath in his Panhard) and dogged effort: it is easy to see that the general pace of the French team, apart from Wagner, who had an accident on the third lap, is all about consistency; while most of the foreign competitors defend a single brand (Mercedes, Fiat), we see the French fighting among themselves: Hemery (Darracq), Heath (Panhard) and Sisz (Renault) are close together, and nothing other than this moving struggle can better bring out the excellence of French construction. However, Hémery deserved his victory, as his curve shows us that he gradually and stubbornly gained on his opponents with each lap.
We could continue in this vein and draw interesting conclusions from the diagram presented to our readers, but we will stop there, as we believe we have sufficiently demonstrated the value of the graphic representation. What we have just explained at length, in two columns of prose, can be read immediately from the appearance of the graph; we are showing the reader the procedure so that he can dissect the exciting episodes of our future sporting events for himself, as we have just done, to his greatest satisfaction.
J. Izart, Engineer.